In Part 1 of this article, I described how climate models are currently insufficient for predicting future hurricane activity. To circumvent this obstacle, researchers turned to historical observation datasets – called reanalysis data – to determine how hurricanes in the past have responded to climate change. By searching reanalysis data to find conditions that likely represent tropical cyclone (TC)-like systems, we can count them up and theoretically see how climate warming has affected the trends in their numbers.
Recall that the reason we need to approach the problem this way is because we do not have an accurate count of TCs prior to the satellite era (~1970). Sixty years of accurate TC counts is not long enough to make confident conclusions about climate shifts.
Historical Trends in Tropical Cyclone Numbers
Does a warmer world produce more or less TCs? Let’s see if we can find out.
The figure below shows results from two recent studies. The left panel shows the annual number of TC numbers from Chand et al. 2022; the right shows the same information from a more recent paper (Jones et al. 2026). Each study used the same reanalysis data (called “20th Century Reanalysis”, or 20CR), which goes all the way back to 1850.
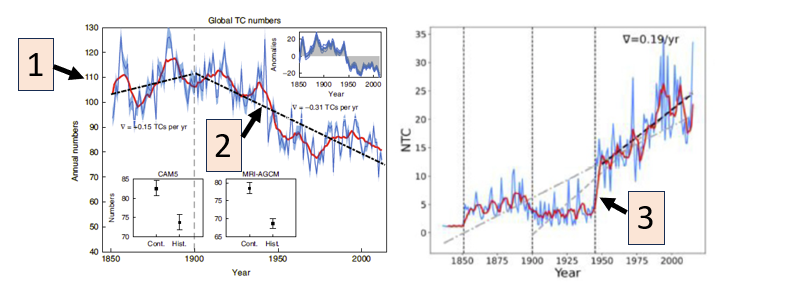
And the answer is…uh…hmmmm. One study shows a decreasing trend in tropical cyclone numbers since 1900, while the other shows an increasing trend. How can this happen? Who is correct?
This contradictory result is a good example of how scientific results can be very sensitive to subtle decisions made by scientists who run the experiments and differences in the data they use. Only by reading the details in each of the papers does it become clearer what is happening here. Let’s break it down by looking at three of the major differences in the results, illustrated by numbered boxes in the figure.
Big differences in TC numbers (#1)
The Chand study identifies 80-110 TCs each year throughout the 20th century, while Jones only shows up to 30. That’s a big difference. The largest factor responsible for this is the choice of minimum TC strength that must be detected in order to count. Chand is showing all systems with a maximum wind speed of at least 15 nautical miles per hour, or knot (kt). This is a very easy threshold to meet and likely represents dozens of systems that would never be classified as a TC. The Jones plot on the right is only showing TCs that achieve at least tropical storm strength – winds of 35 kt or higher. There’s many fewer of these than weak 15 kt systems, so the overall counts are much smaller.
Opposite trends in TC numbers (#2)
One goes down; the other goes up. Strange result at first glance. Part of the explanation lies in the TC threshold strength described above. The Jones result (right panel) only includes tropical storm or stronger systems. When weaker storms are included, Jones does indeed show that there is a global decreasing trend in TCs, suggesting that climate warming is anathema for weak storms. However, some argue that this decreasing trend is a data artifact and not physical, but I’ll leave that topic for another time!
Sudden jump in TC numbers around 1945 (#3)
Difference #3 is related to #2. Part of the reason we see an increasing trend for the entire Jones time series is a large, unnatural jump in TCs that show up around 1945. This isn’t an actual physical increase in TCs, but rather a data issue. Before 1945, TCs in the western North Pacific – the most active of all TC basins – were not included in global TC records used to help construct the reanalysis data. Adding this data in, combined with the improved detection and reporting of TCs immediately after World War II, produces a sudden increase of 20 TCs in the global record. Take this out and the global trend becomes only slightly positive or even neutral.
This jump isn’t seen in the Chand record because they used an earlier version of the 20CR dataset that did not include the WNP data.
Take Aways
The most important message here is that science, even great science, is messy and rarely provides clear answers to our questions. Climate scientists are generally confident that climate warming leads to stronger and wetter TCs. Our direct observations of storms over the last three decades suggest this is already occurring. But on the question of hurricane numbers, the answer is unclear.
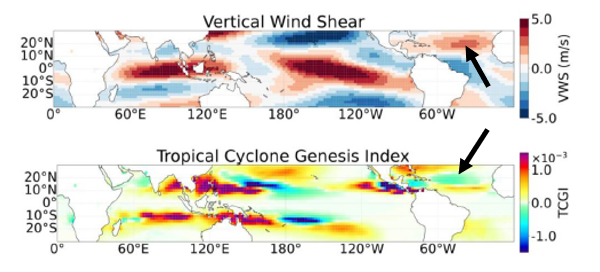
If you live in the United States near the eastern or southern coasts, I’m sure you’d like a better answer than that. Personally, I’m confident that the north Atlantic Ocean is becoming more hostile to TC formation as the climate warms. The figure below shows changes in vertical wind shear and a TC formation (genesis) index – which combines several factors important for TC formation into one value – compared to the late 19th century. Vertical wind shear, which hinders TC formation, is notably higher while the TC genesis index is negative, indicating a trend toward unfavorable conditions. Other environmental factors such as surface pressure and moisture (not shown) are also trending toward more challenging TC formation conditions.
Of course, there are always complicating factors that affect any one season, potentially bucking the trend in either direction. As I write this on September 23, 2026, there have been a grand total of zero hurricanes this season in the north Atlantic. Thank you, Mr. El Niño!
References:
Chand, S.S., and coauthors, 2022: Declining tropical cyclone frequency under global warming. Nature Climate Change, Vol. 12, 655-661. Available at https://doi.org/10.1038/s41558-022-01388-4 .
Jones, K.R., J-Y Zhuo, S.J. Camargo, K.I. Hodges, S.S. Bell, and S.S. Chand, 2026: Re-examining historical trends of tropical cyclone frequency. Geophysical Research Letters, 53, e2026GL122083. Available at https://doi.org/10.1029/2026GL122083 .
Dr. Chris Hennon is the Founder and Lead Consultant for Hennon Weather Services LLC. He is a Certified Consulting Meteorologist and former Professor of Atmospheric Science with expertise in Tropical Meteorology and Weather Forecasting.