One of the most important skills I use as a forensic meteorologist is to explain my methods and findings in a clear, concise, and complete way. My experience as a professor helped me to develop this skill. Translating complex mathematical equations into practical understanding for students is very similar to explaining technical and complicated data and methods to my clients, the judges in the courtroom, and the juries that decide case outcomes.
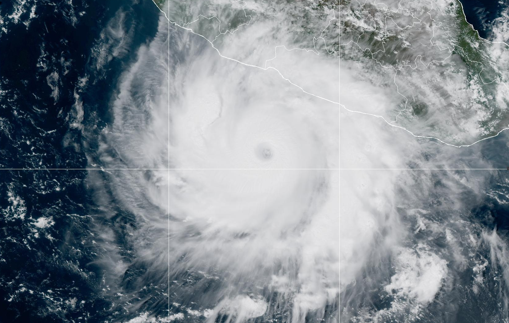
My experience in hurricane/tropical cyclone (TC) research, mentoring student research, TC forensic cases, and work at the National Hurricane Center gives me a unique skill set to distill complicated TC topics into a more digestible package for public consumption. One of the more misunderstood areas is how TC frequency – how many TCs develop in a given season – will change in this warming world.
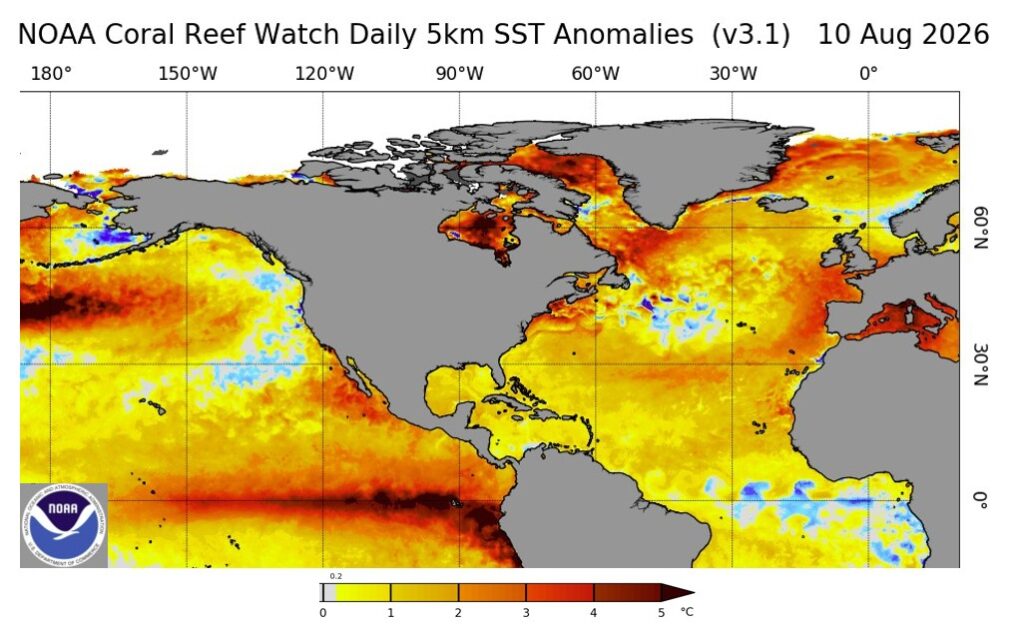
Maybe your first instinct would be to assume that warmer conditions = more TCs. TCs get their energy from the oceans, so warmer oceans would lead to more storms, right? But if we dig a little deeper, there is ambiguity. TC development requires much more than just warm water. TCs need relatively small changes in wind speed and direction with height (called wind shear), lots of moisture in the middle atmosphere, and an area where large-scale winds are swirling counter-clockwise (called vorticity) to help concentrate the thunderstorms and the heat energy. Here in summer 2026, the ocean temperatures in the Atlantic are 1-3°C warmer than average, and yet the very strong El Nino – which produces strong wind shear across the Atlantic – has most meteorologists predicting a quiet hurricane season.
Weather Models Can’t Do Everything
In both meteorology and climatology, we employ physics-based models to predict future states of the atmosphere. A model is a simplified representation of reality. It takes incomplete and imperfect information (weather observations), applies that data to fundamental laws of physics, and makes predictions of weather variables (e.g., temperature, winds, humidity) on a 3-dimensional grid.
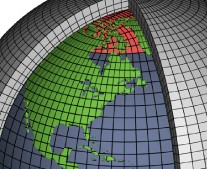
Applying models to predict future hurricane behavior is problematic. Without getting too deep into the weeds, the main reason is TCs are too small for the models to simulate. The models can only make predictions for a limited number of locations – called grid points. For climate models, the distance between the grid points is typically tens to hundreds of kilometers (60-200 miles for the metrically challenged). TCs average 200-500 km in total width, which would only be captured by a few grid points at most. Not enough to even show up as a TC in the simulation.
Looking To The Past
But wait, we know how much the Earth has warmed in the last 150 years or so. Since the mid-19th century humanity has been taking regular weather observations in many places. Can’t we just count the number of hurricanes that have formed each year over that time and use that information to inform our predictions for the next century?
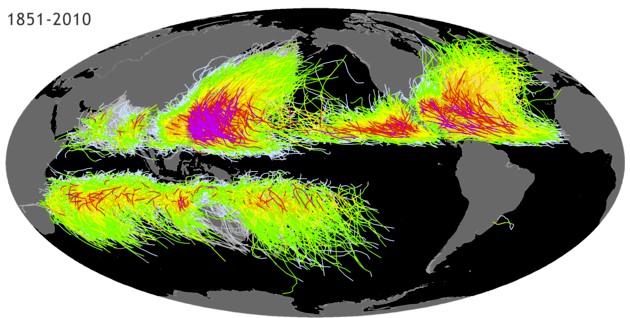
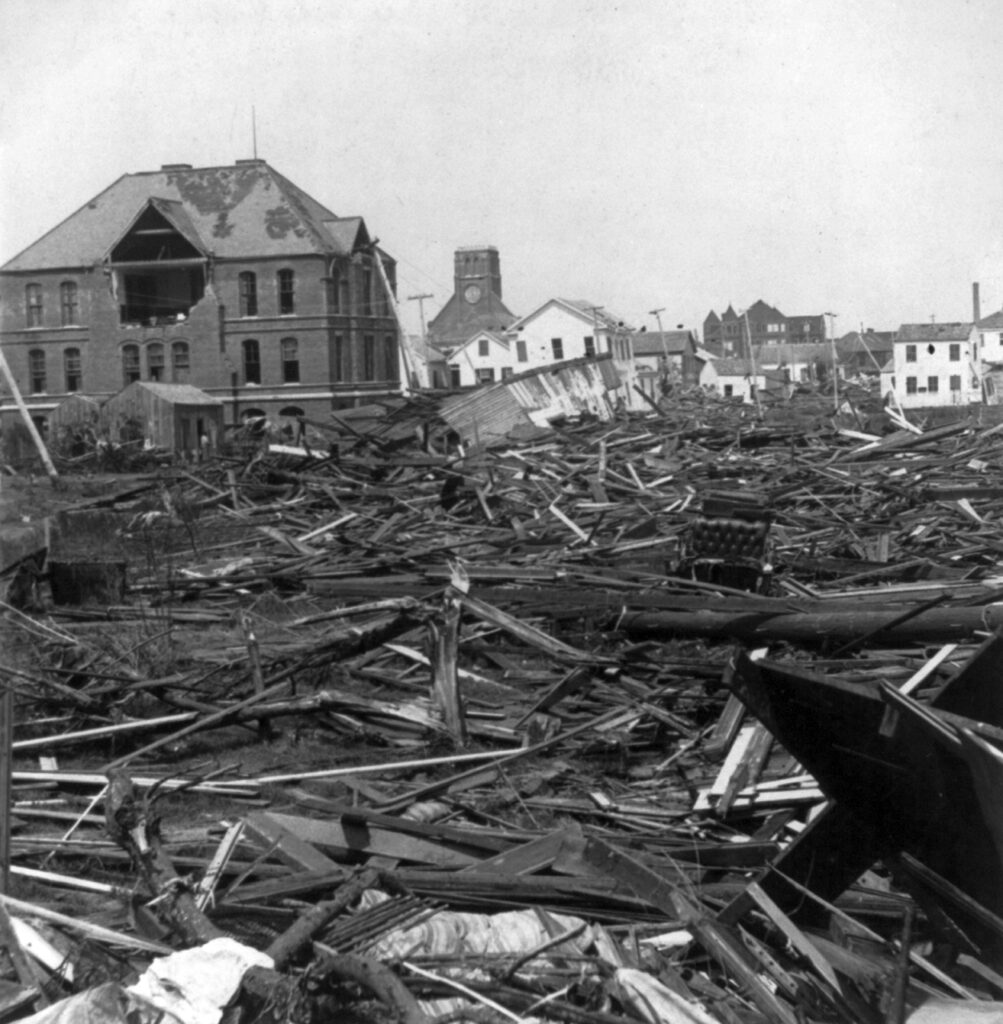
Sounds great, but…it turns out that nobody knows for sure how many TCs there were before we began tracking them with satellites in the late 1960s. Before then, just a subset of TCs were actually recorded in the history books – typically by ships or when the storm came ashore. Others were “fish storms” that formed, moved, and dissipated out in the ocean, never to be known by humans. The deadliest TC in U.S. history – the Galveston hurricane of 1900 – drowned several thousand residents because U.S. meteorologists believed the storm would track along the east coast, failing to warn the populace of its approach until it was too late.
The reliable TC count record is only about 55 years long – too short to use for climate studies.
Can Reanalysis Data Help?
There is a potential solution to the counting issue in the form of reanalysis data. What is it? Basically, we gather all of the historical observations of the earth-atmosphere system going back many decades. These will be incomplete and irregular in both space and time. To make order out of disorder, the observations are fed into a modern weather model. Here, the purpose of the model is not to make a prediction, but to make an analysis of what the entire atmosphere may have looked like at a given time based on the incomplete observations.
The model will use the laws of energy and motion to produce a reasonable picture of the atmosphere at that time. The output is a complete 3-dimensional grid of many variables such as temperature, winds, and moisture (see figure above) – usually every 3-6 hours – from present back to however far in the past the particular reanalysis product goes – sometimes to the 19th century.
Reanalysis datasets are incredibly useful in many areas of meteorology and climate. However, for hurricane applications, they suffer from the same shortcoming as the climate prediction models. Typical TC diameters (75 – 250 km) are too small for reanalysis datasets to explicitly represent hurricanes. For comparison, modern models that predict hurricanes have resolutions on the order of 2-27 km.
Counting By Proxy
But all is not lost. It turns out that we can use reanalysis data for hurricane counting if we search for TC signatures instead of TCs themselves. Think of a signature as clues in the coarse reanalysis data that suggest a TC is there, even though there isn’t. Things like: concentrated areas of swirling winds (that vorticity again), high amounts of moisture, low vertical wind shear, and good continuity (favorable conditions that persist for at least a couple of days).
In Part II, I’ll take you through two studies that counted historical TCs by finding signatures in two different versions of the same reanalysis dataset. Their conclusions show how subtle differences in data and assumptions can lead to two completely different opinions on how climate change has affected historical TC trends; and thus, how future warming may influence TC frequency.
Dr. Chris Hennon is the Founder and Lead Consultant for Hennon Weather Services LLC. He is a Certified Consulting Meteorologist and former Professor of Atmospheric Science with expertise in Tropical Meteorology and Weather Forecasting.