Jackson County, NC is home to some of the most beautiful landscapes in the Great Smokey Mountains of southern Appalachia. Lush, deep green forests cover ancient mountain landscapes, with vibrant rivers flowing down through the valleys. Towns like Sylva radiate southern charm, attracting visitors from around the southeast with beauty and good beer.
This region of North Carolina is known as the Appalachian cloud forest or temperate rainforest for its unique climate. The area receives bountiful rains – and snow – averaging 55-80” of accumulated precipitation per year. The frequent rains and high elevation produce a relatively cool, humid environment ideal for harboring a diverse biome of plants not found anywhere else in the southeast United States.
The summer of 2026 has been a very wet one for the rainforest. As is typical, thunderstorms erupt daily over the area, driven by the strong summer sun and moist air at the surface. Regional observations show that parts of Jackson County had received about 8”-9” of rain in July, well above the monthly average of 5”.
Oh, and the area is experiencing a severe drought.
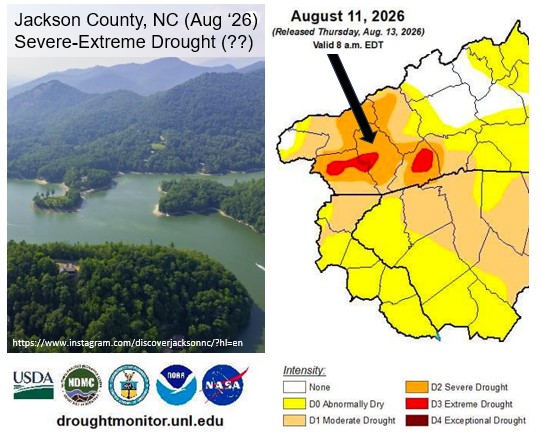
Say what? Many locals were dumbfounded when the government and media informed them that there is a drought. Sure, the region had a dry spring. But it’s been raining buckets! Comments on social media reflected the state of confusion as the citizens tried to reconcile what they have been observing (heavy rains, overgrown lawns, filled reservoirs) to what officials were reporting. For example, Erin on Facebook writes:
“We’ve gotten insane amounts of rain since late May in that red section of Jackson County. I just can’t believe this is correct. I have recorded 40 inches of rain this year.”
So, what’s the deal? Is Jackson County in a drought? Are the government and media full of it? Or is it something in between. Let’s take a look and see if we can come up with a reasonable answer.
What is Drought?
A key point of confusion is how drought is defined and how that definition can be at odds with one’s perception of events. In a dictionary, drought is defined simply (and subjectively) as a period of dryness, especially when prolonged. If meteorologists were strictly adhering to this definition, I believe we would determine that there is no longer a drought in Jackson County.
But in practice, defining drought is more nuanced. The American Meteorological Society – the most notable U.S. scientific organization of weather, water, and climate professionals – defines four different kinds of drought: meteorological, agricultural, hydrological, and socioeconomic. Each of these might give you a different answer about the presence of drought. Let’s see why by digging deeper into meteorological and agricultural droughts.
Meteorological Drought
Meteorological drought is probably how many of you think drought is measured. It takes the amount of precipitation measured and compares it to how much is expected (long-term average, or climatology). Surplus? No drought. Deficit? Drought (maybe).
The figure below shows the Standard Precipitation Index (SPI), which is a common metric that measures meteorological drought. Warm colors indicate a precipitation deficit and cool colors a surplus. We can see that Jackson County (black arrow) has been experiencing moderately wet conditions over the last 15 days, consistent with Erin’s and other resident’s personal observations.
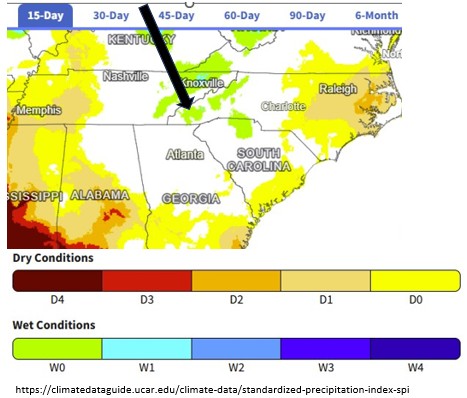
The SPI is popular because it is simple. It only requires precipitation data and one can directly compare conditions across different regions (e.g., the southeast U.S. and the desert southwest). But there are shortcomings. Precipitation is not the only factor that contributes to drought. To form a more complete picture, we have to consider what happens to the rain when it hits the ground and how much water is leaving the soil over time. Agricultural drought accounts for this.
Agricultural Drought
Drought may be an inconvenience for some but for farmers and others who make a living in agriculture, it can be the difference between making it or not. Agricultural drought considers the practical impacts that conditions have on agriculture. It includes not only precipitation but the amount of water leaving the soil through evaporation and runoff into rivers and underground reservoirs.
The figure below is the Palmer Drought Severity Index (PDSI), one measure of agricultural drought. The PDSI was originally developed in the mid-1960s and remains a popular tool for assessing drought. It requires temperature and precipitation data to run what’s called a “water balance model”. Basically, it’s computer code that figures out how much water is in the soil, which of course is critical for growing things.
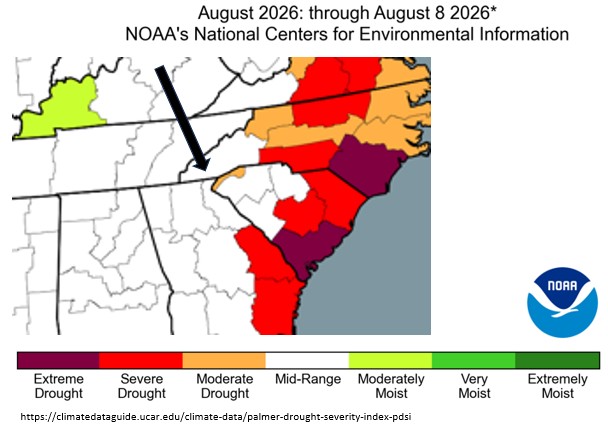
We can see that Jackson County is categorized as “Mid-Range” in the PDSI – drier than the SPI but not abnormally so. Unlike the SPI, the PDSI is considered more of a long-term measure of drought. It doesn’t respond quickly to a brief wet period, like a couple of months of above average rainfall. But even when accounting for the dry spring, we can conclude that according to the PDSI, there is no agricultural drought in Jackson County.
U.S. Drought Monitor
Both the SPI and PDSI seem to confirm what our eyes (and rain gauges) have been telling us – Jackson County is not in a drought. And yet, we’re being told we are. That’s because the perceived final say in drought comes from the U.S. Drought Monitor (USDM). What is it and how can it be so different than other measures of drought?
The USDM is a collaboration between government and academic organizations. It’s not a single, objective tool, but rather combines physical data (like precipitation) and metrics such as the SPI and PDSI with subjective human expertise. Each week, about 425 “observers”, situated around the country, evaluate all of the drought indicators. These may include precipitation data, the SPI, the PDSI, stream flow, reservoir levels, and even conversations with locals. One of the nice things about the USDM is humans are involved in the decision process and can make intelligent decisions based on complex and sometimes conflicting information.
The end product of this large collaboration is a map that is released every Thursday (see first figure above). It’s meant to be a snapshot of current drought conditions, updating the map that was released the previous week. The USDM is used to guide government agencies in officially declaring droughts, but isn’t considered the “be all end all” product.
Is Jackson County in a Drought or not?
The USDM says that most of Jackson County is in “Severe Drought” with some western portions of the county in “Extreme Drought”. Both the SPI and PDSI suggest Jackson County has no drought. So, are we or not?
In my professional opinion, I have to say…NO! I don’t know for sure about the inner workings of the USDM map, but I have to believe that the current map suffers from a serious case of lethargy – very slow to change. Jackson County did have a very dry spring, with below average precipitation for February-April. But annual precipitation totals have recovered to just below normal, lakes are full, crops are not stressed, and the streams are flowing nicely. Even in the face of 3-4 months of normal and above normal precipitation, the observers responsible for the USDM map still seem to believe that we are in the midst of a springtime dry spell.
So please, Mr. Facebook Weather Guy, can we stop hearing about our “drought” every week with the big red alert maps? We’re fine. Have a beer. Thank you. 🙂
Dr. Chris Hennon is the Founder and Lead Consultant for Hennon Weather Services LLC. He is a Certified Consulting Meteorologist and former Professor of Atmospheric Science with expertise in Tropical Meteorology and Weather Forecasting.